My fraud detection model was deployed and working. Or so I thought.
Three weeks later, I checked the logs. Accuracy had dropped from 95% to 78%. Prediction latency had doubled. The model was basically broken, and I had no idea.
No alerts. No dashboards. No monitoring. Just silent failure.
I spent the next week building a proper monitoring system with Prometheus and Grafana. Added Airflow to automatically retrain when performance dropped.
Now? I get Slack alerts when accuracy dips. Dashboards show me exactly what's happening. Airflow retrains automatically. I sleep better at night.
If you deploy ML models without monitoring, you're flying blind. Let me show you how to build a complete monitoring and retraining system so you don't make my mistake.
Why ML Monitoring is Different (and Harder)
Traditional software monitoring: Is the service up? Are requests succeeding?
ML monitoring: All that PLUS:
Is the model still accurate?
Are predictions drifting?
Is the data distribution changing?
Are feature values in expected ranges?
When should we retrain?
The problem: Your API can be "working" (returning 200 OK) while your model is completely broken.
Real example from my fraud detection system:
Week 1: Accuracy 95%, Precision 92%, Latency 80ms ✅
Week 2: Accuracy 94%, Precision 91%, Latency 85ms ✅
Week 3: Accuracy 89%, Precision 86%, Latency 120ms ⚠️
Week 4: Accuracy 78%, Precision 71%, Latency 180ms 🔥
Without monitoring, I would never have noticed until users complained.
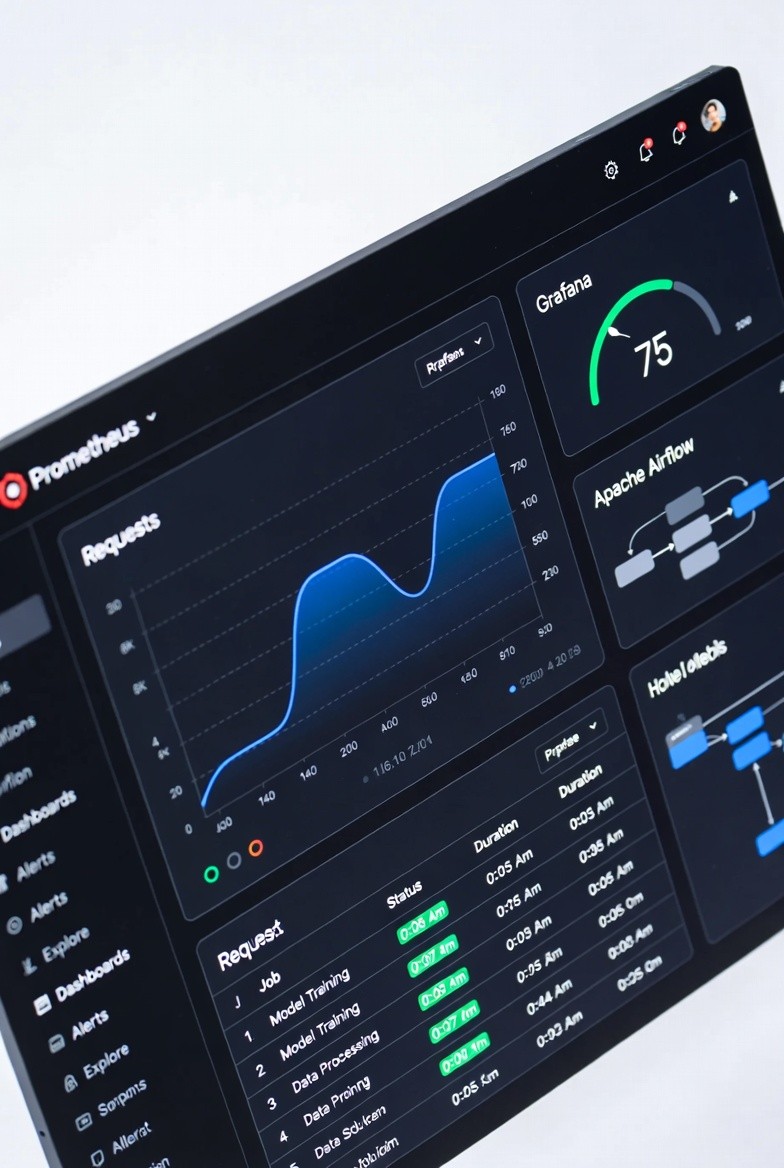
The Complete Monitoring Stack
Here's what we're building:
Prometheus: Collects and stores metrics
Grafana: Visualizes metrics in dashboards
Airflow: Monitors performance and triggers retraining
FastAPI: Your ML service (instrumented with metrics)
The flow:
FastAPI exposes metrics (predictions, latency, accuracy)
Prometheus scrapes metrics every 15 seconds
Grafana displays real-time dashboards
Airflow checks metrics daily
If performance drops → Airflow retrains model
New model deploys automatically
Part 1: Instrumenting Your ML API
First, add metrics to your FastAPI application.
Install Dependencies
Basic FastAPI with Prometheus Metrics
python
from fastapi import FastAPI
from prometheus_client import Counter, Histogram, Gauge, generate_latest
from prometheus_fastapi_instrumentator import Instrumentator
import time
import numpy as np
app = FastAPI(title="Fraud Detection API")
predictions_total = Counter(
'ml_predictions_total',
'Total number of predictions made',
['model_version', 'prediction']
)
prediction_latency = Histogram(
'ml_prediction_latency_seconds',
'Prediction latency in seconds',
buckets=[0.01, 0.05, 0.1, 0.25, 0.5, 1.0, 2.5, 5.0]
)
prediction_errors = Counter(
'ml_prediction_errors_total',
'Total prediction errors',
['error_type']
)
fraud_rate = Gauge(
'ml_fraud_rate_current',
'Current fraud detection rate (rolling window)'
)
model_accuracy = Gauge(
'ml_model_accuracy',
'Model accuracy (when ground truth available)',
['model_version']
)
feature_stats = Gauge(
'ml_feature_value',
'Feature statistics',
['feature_name', 'stat_type']
)
Instrumentator().instrument(app).expose(app)
MODEL_VERSION = "v1.2.0"
model = load_model()
@app.post("/predict")
async def predict(transaction: dict):
"""Make fraud prediction with full instrumentation"""
start_time = time.time()
try:
features = extract_features(transaction)
for feature_name, value in features.items():
feature_stats.labels(
feature_name=feature_name,
stat_type='current'
).set(value)
prediction = model.predict([list(features.values())])[0]
prediction_proba = model.predict_proba([list(features.values())])[0]
latency = time.time() - start_time
prediction_latency.observe(latency)
predictions_total.labels(
model_version=MODEL_VERSION,
prediction='fraud' if prediction == 1 else 'legitimate'
).inc()
if prediction == 1:
fraud_rate.set(fraud_rate._value.get() + 0.01)
return {
"prediction": int(prediction),
"probability": float(prediction_proba[1]),
"model_version": MODEL_VERSION,
"latency_ms": round(latency * 1000, 2)
}
except Exception as e:
prediction_errors.labels(error_type=type(e).__name__).inc()
raise e
@app.post("/feedback")
async def feedback(transaction_id: str, actual_fraud: bool):
"""Receive ground truth for accuracy tracking"""
predicted_fraud = get_prediction(transaction_id)
is_correct = (predicted_fraud == actual_fraud)
current_accuracy = model_accuracy.labels(
model_version=MODEL_VERSION
)._value.get()
new_accuracy = 0.9 * current_accuracy + 0.1 * (1.0 if is_correct else 0.0)
model_accuracy.labels(model_version=MODEL_VERSION).set(new_accuracy)
return {"status": "feedback recorded"}
@app.get("/health")
async def health():
"""Health check endpoint"""
return {
"status": "healthy",
"model_version": MODEL_VERSION
}
@app.get("/metrics")
async def metrics():
"""Prometheus metrics endpoint"""
from starlette.responses import Response
return Response(content=generate_latest(), media_type="text/plain")
if __name__ == "__main__":
import uvicorn
uvicorn.run(app, host="0.0.0.0", port=8000)What we're tracking:
✅ Total predictions (by class and model version)
✅ Prediction latency (with percentiles)
✅ Error rates (by error type)
✅ Fraud detection rate
✅ Model accuracy (when ground truth available)
✅ Feature statistics
Part 2: Setting Up Prometheus
Prometheus scrapes metrics from your API.
Prometheus Configuration (prometheus.yml)
yaml
global:
scrape_interval: 15s
evaluation_interval: 15s
alerting:
alertmanagers:
- static_configs:
- targets: ['alertmanager:9093']
rule_files:
- "alerts.yml"
scrape_configs:
- job_name: 'fraud-detection-api'
static_configs:
- targets: ['api:8000']
metrics_path: '/metrics'
scrape_interval: 15s
- job_name: 'prometheus'
static_configs:
- targets: ['localhost:9090'
Alert Rules (alerts.yml)
yaml
groups:
- name: ml_model_alerts
interval: 30s
rules:
- alert: ModelAccuracyLow
expr: ml_model_accuracy < 0.85
for: 5m
labels:
severity: warning
component: ml_model
annotations:
summary: "Model accuracy dropped below 85%"
description: "Model {{ $labels.model_version }} accuracy is {{ $value }}"
- alert: PredictionLatencyHigh
expr: histogram_quantile(0.95, rate(ml_prediction_latency_seconds_bucket[5m])) > 0.5
for: 5m
labels:
severity: warning
component: api
annotations:
summary: "P95 prediction latency above 500ms"
description: "P95 latency is {{ $value }}s"
- alert: PredictionErrorRateHigh
expr: rate(ml_prediction_errors_total[5m]) > 0.1
for: 2m
labels:
severity: critical
component: ml_model
annotations:
summary: "Prediction error rate above 10%"
description: "Error rate is {{ $value }} errors/sec"
- alert: FraudRateAnomaly
expr: abs(ml_fraud_rate_current - ml_fraud_rate_current offset 24h) > 0.05
for: 10m
labels:
severity: info
component: ml_model
annotations:
summary: "Fraud rate changed significantly"
description: "Fraud rate: {{ $value }} (24h ago: {{ $value offset 24h }})"
- alert: ModelRetrainingNeeded
expr: |
ml_model_accuracy < 0.90 or
histogram_quantile(0.95, rate(ml_prediction_latency_seconds_bucket[5m])) > 0.3
for: 30m
labels:
severity: warning
component: ml_model
annotations:
summary: "Model needs retraining"
description: "Trigger Airflow retraining DAG"Docker Compose (docker-compose.yml)
yaml
version: '3.8'
services:
api:
build: .
ports:
- "8000:8000"
environment:
- MODEL_PATH=/models/fraud_model.pkl
volumes:
- ./models:/models
restart: unless-stopped
prometheus:
image: prom/prometheus:latest
ports:
- "9090:9090"
volumes:
- ./prometheus.yml:/etc/prometheus/prometheus.yml
- ./alerts.yml:/etc/prometheus/alerts.yml
- prometheus_data:/prometheus
command:
- '--config.file=/etc/prometheus/prometheus.yml'
- '--storage.tsdb.path=/prometheus'
- '--web.console.libraries=/usr/share/prometheus/console_libraries'
- '--web.console.templates=/usr/share/prometheus/consoles'
restart: unless-stopped
grafana:
image: grafana/grafana:latest
ports:
- "3000:3000"
environment:
- GF_SECURITY_ADMIN_PASSWORD=admin
- GF_USERS_ALLOW_SIGN_UP=false
volumes:
- grafana_data:/var/lib/grafana
- ./grafana/dashboards:/etc/grafana/provisioning/dashboards
- ./grafana/datasources:/etc/grafana/provisioning/datasources
depends_on:
- prometheus
restart: unless-stopped
postgres:
image: postgres:15
environment:
- POSTGRES_USER=airflow
- POSTGRES_PASSWORD=airflow
- POSTGRES_DB=airflow
volumes:
- postgres_data:/var/lib/postgresql/data
restart: unless-stopped
airflow-webserver:
image: apache/airflow:2.7.0
depends_on:
- postgres
environment:
- AIRFLOW__CORE__EXECUTOR=LocalExecutor
- AIRFLOW__DATABASE__SQL_ALCHEMY_CONN=postgresql+psycopg2://airflow:airflow@postgres/airflow
- AIRFLOW__CORE__FERNET_KEY=your-fernet-key-here
- AIRFLOW__CORE__LOAD_EXAMPLES=False
volumes:
- ./dags:/opt/airflow/dags
- ./models:/models
- airflow_logs:/opt/airflow/logs
ports:
- "8080:8080"
command: webserver
restart: unless-stopped
airflow-scheduler:
image: apache/airflow:2.7.0
depends_on:
- postgres
environment:
- AIRFLOW__CORE__EXECUTOR=LocalExecutor
- AIRFLOW__DATABASE__SQL_ALCHEMY_CONN=postgresql+psycopg2://airflow:airflow@postgres/airflow
- AIRFLOW__CORE__FERNET_KEY=your-fernet-key-here
volumes:
- ./dags:/opt/airflow/dags
- ./models:/models
- airflow_logs:/opt/airflow/logs
command: scheduler
restart: unless-stopped
volumes:
prometheus_data:
grafana_data:
postgres_data:
airflow_logs
Start everything:
bash

docker-compose up -d
Access:
Part 3: Building Grafana Dashboards
Grafana turns Prometheus metrics into visual dashboards.
Configure Prometheus Data Source
grafana/datasources/prometheus.yml:
yaml

apiVersion: 1

datasources:
  - name: Prometheus
    type: prometheus
    access: proxy
    url: http://prometheus:9090
    isDefault: true
    editable: false
Dashboard Configuration
grafana/dashboards/dashboard.yml:
yaml

apiVersion: 1

providers:
  - name: 'ML Monitoring'
    orgId: 1
    folder: ''
    type: file
    disableDeletion: false
    updateIntervalSeconds: 10
    options:
      path
ML Model Dashboard (JSON)
Create grafana/dashboards/ml-dashboard.json:
json

{
  "dashboard": {
    "title": "ML Model Monitoring",
    "panels": [
      {
        "title": "Predictions per Minute",
        "targets": [
          {
            "expr": "rate(ml_predictions_total[1m]) * 60"
          }
        ],
        "type": "graph"
      },
      {
        "title": "Model Accuracy",
        "targets": [
          {
            "expr": "ml_model_accuracy"
          }
        ],
        "type": "stat",
        "fieldConfig": {
          "defaults": {
            "thresholds": {
              "steps": [
                {"value": 0, "color": "red"},
                {"value": 0.85, "color": "yellow"},
                {"value": 0.95, "color": "green"}
              ]
            }
          }
        }
      },
      {
        "title": "P95 Latency",
        "targets": [
          {
            "expr": "histogram_quantile(0.95, rate(ml_prediction_latency_seconds_bucket[5m]))"
          }
        ],
        "type": "graph"
      },
      {
        "title": "Error Rate",
        "targets": [
          {
            "expr": "rate(ml_prediction_errors_total[5m])"
          }
        ],
        "type": "graph"
      },
      {
        "title": "Fraud Detection Rate",
        "targets": [
          {
            "expr": "ml_fraud_rate_current"
          }
        ],
        "type": "stat"
      },
      {
        "title": "Predictions by Class",
        "targets": [
          {
            "expr": "ml_predictions_total",
            "legendFormat": "{{prediction}}"
          }
        ],
        "type": "piechart"
      }
    ]
  }
}
Key panels you need:
Predictions per Minute - Request volume
Model Accuracy - Current performance (color-coded)
P50/P95/P99 Latency - Response time percentiles
Error Rate - Failures over time
Fraud Rate - Detection rate trends
Feature Distribution - Input data drift
Model Version - Track which version is deployed
Part 4: Airflow for Automated Retraining
Now the magic: Airflow monitors Prometheus and triggers retraining when needed.
Airflow DAG: Model Retraining Pipeline
dags/ml_retraining.py:
python
from airflow import DAG
from airflow.operators.python import PythonOperator
from airflow.sensors.python import PythonSensor
from datetime import datetime, timedelta
import requests
import pandas as pd
from sklearn.ensemble import RandomForestClassifier
import joblib
import mlflow
default_args = {
'owner': 'ml-team',
'depends_on_past': False,
'email_on_failure': True,
'email': ['alerts@company.com'],
'retries': 2,
'retry_delay': timedelta(minutes=5)
}
dag = DAG(
'ml_model_retraining',
default_args=default_args,
description='Automated ML model retraining based on performance',
schedule_interval='0 2 * * *',
start_date=datetime(2025, 1, 1),
catchup=False,
tags=['ml', 'retraining']
)
def check_model_performance():
"""Query Prometheus to check if retraining is needed"""
prometheus_url = "http://prometheus:9090/api/v1/query"
accuracy_query = "ml_model_accuracy"
response = requests.get(prometheus_url, params={'query': accuracy_query})
accuracy = float(response.json()['data']['result'][0]['value'][1])
latency_query = "histogram_quantile(0.95, rate(ml_prediction_latency_seconds_bucket[1h]))"
response = requests.get(prometheus_url, params={'query': latency_query})
p95_latency = float(response.json()['data']['result'][0]['value'][1])
print(f"Current accuracy: {accuracy}")
print(f"Current P95 latency: {p95_latency}s")
needs_retraining = (
accuracy < 0.90 or
p95_latency > 0.3
)
if needs_retraining:
print("⚠️ Model needs retraining!")
else:
print("✅ Model performance is acceptable")
return needs_retraining
def prepare_training_data(**context):
"""Pull fresh training data"""
print("📊 Preparing training data...")
query = """
SELECT * FROM transactions
WHERE timestamp > NOW() - INTERVAL '90 days'
AND label IS NOT NULL
"""
df = load_recent_data()
print(f"Loaded {len(df)} training samples")
df.to_parquet('/tmp/training_data.parquet')
return len(df)
def train_new_model(**context):
"""Train new model with fresh data"""
print("🔧 Training new model...")
df = pd.read_parquet('/tmp/training_data.parquet')
X = df.drop(['label', 'transaction_id', 'timestamp'], axis=1)
y = df['label']
from sklearn.model_selection import train_test_split
X_train, X_test, y_train, y_test = train_test_split(
X, y, test_size=0.2, random_state=42
)
with mlflow.start_run(run_name=f"retrain_{datetime.now().strftime('%Y%m%d_%H%M')}"):
model = RandomForestClassifier(
n_estimators=100,
max_depth=10,
min_samples_split=5,
random_state=42,
n_jobs=-1
)
model.fit(X_train, y_train)
from sklearn.metrics import accuracy_score, precision_score, recall_score, f1_score
y_pred = model.predict(X_test)
accuracy = accuracy_score(y_test, y_pred)
precision = precision_score(y_test, y_pred)
recall = recall_score(y_test, y_pred)
f1 = f1_score(y_test, y_pred)
print(f"New model accuracy: {accuracy:.4f}")
print(f"New model precision: {precision:.4f}")
print(f"New model recall: {recall:.4f}")
print(f"New model F1: {f1:.4f}")
mlflow.log_param("n_estimators", 100)
mlflow.log_param("max_depth", 10)
mlflow.log_param("training_samples", len(X_train))
mlflow.log_metric("accuracy", accuracy)
mlflow.log_metric("precision", precision)
mlflow.log_metric("recall", recall)
mlflow.log_metric("f1", f1)
model_path = f'/models/fraud_model_{datetime.now().strftime("%Y%m%d_%H%M")}.pkl'
joblib.dump(model, model_path)
mlflow.sklearn.log_model(model, "model")
context['task_instance'].xcom_push(key='new_model_path', value=model_path)
context['task_instance'].xcom_push(key='new_accuracy', value=accuracy)
return accuracy
def validate_new_model(**context):
"""Validate new model before deployment"""
print("✅ Validating new model...")
prometheus_url = "http://prometheus:9090/api/v1/query"
response = requests.get(prometheus_url, params={'query': 'ml_model_accuracy'})
current_accuracy = float(response.json()['data']['result'][0]['value'][1])
new_accuracy = context['task_instance'].xcom_pull(
task_ids='train_model',
key='new_accuracy'
)
print(f"Current production accuracy: {current_accuracy:.4f}")
print(f"New model accuracy: {new_accuracy:.4f}")
improvement = new_accuracy - current_accuracy
if new_accuracy >= current_accuracy * 0.98:
print(f"✅ New model approved! Improvement: {improvement:+.4f}")
return True
else:
print(f"❌ New model rejected. Performance drop: {improvement:.4f}")
raise ValueError("New model performs worse than current model")
def deploy_model(**context):
"""Deploy new model to production"""
print("🚀 Deploying new model...")
model_path = context['task_instance'].xcom_pull(
task_ids='train_model',
key='new_model_path'
)
import shutil
shutil.copy(model_path, '/models/fraud_model.pkl')
print(f"Deployed model from {model_path}")
return model_path
def send_notification(**context):
"""Send notification about retraining"""
new_accuracy = context['task_instance'].xcom_pull(
task_ids='train_model',
key='new_accuracy'
)
message = f"""
🎉 Model Retraining Complete!
New model deployed with accuracy: {new_accuracy:.2%}
Timestamp: {datetime.now().strftime('%Y-%m-%d %H:%M:%S')}
Check Grafana for updated metrics.
"""
print(message)
return message
check_performance = PythonSensor(
task_id='check_performance',
python_callable=check_model_performance,
mode='poke',
poke_interval=300,
timeout=3600,
dag=dag
)
prepare_data = PythonOperator(
task_id='prepare_data',
python_callable=prepare_training_data,
dag=dag
)
train_model = PythonOperator(
task_id='train_model',
python_callable=train_new_model,
dag=dag
)
validate_model = PythonOperator(
task_id='validate_model',
python_callable=validate_new_model,
dag=dag
)
deploy = PythonOperator(
task_id='deploy_model',
python_callable=deploy_model,
dag=dag
)
notify = PythonOperator(
task_id='send_notification',
python_callable=send_notification,
dag=dag
)
check_performance >> prepare_data >> train_model >> validate_model >> deploy >> notify
```
**What this DAG does:**
1. **check_performance** - Queries Prometheus, decides if retraining needed
2. **prepare_data** - Pulls fresh training data (last 90 days)
3. **train_model** - Trains new model, logs to MLflow
4. **validate_model** - Ensures new model is better
5. **deploy** - Deploys new model to production
6. **notify** - Sends Slack notification
**The magic:** Fully automated. If accuracy drops, Airflow retrains without human intervention.
---
Let me show you how everything works together:
```
1. User makes API request
2. API makes prediction, records metrics
3. Prometheus scrapes metrics every 15s
4. Grafana displays real-time dashboards
5. Accuracy: 95% ✅
6. Latency: 80ms ✅
7. Everyone's happy
```
### **Performance Degradation**
```
Week 1: Accuracy 95%
Week 2: Accuracy 93%
Week 3: Accuracy 89% ⚠️
Week 4: Accuracy 86% 🚨
Prometheus Alert: "ModelAccuracyLow" fires
Airflow DAG: check_performance sensor detects issue
```
### **Automatic Retraining**
```
Day 1, 2:00 AM:
- Airflow checks Prometheus
- Accuracy: 86% < 90% threshold
- Decision: Retrain needed ✅
Day 1, 2:05 AM:
- Pull last 90 days of data
- 150,000 transactions loaded
Day 1, 2:15 AM:
- Train new Random Forest model
- New accuracy: 94%
- Log to MLflow
Day 1, 2:20 AM:
- Validate: 94% > 86% ✅
- Deploy new model
- Restart API
Day 1, 2:25 AM:
- Slack notification sent
- Grafana shows new model version
- Accuracy back to 94% ✅The Result
✅ Self-healing system
✅ No manual intervention
✅ Performance maintained
✅ Full visibility
Part 6: Key Metrics to Monitor
Here's what you MUST track:
Model Performance Metrics
python
model_accuracy = Gauge('ml_model_accuracy', ...)
model_precision = Gauge('ml_model_precision', ...)
model_recall = Gauge('ml_model_recall', ...)
model_f1 = Gauge('ml_model_f1', ...)
model_auc = Gauge('ml_model_auc', ...)Operational Metrics
python
predictions_total = Counter('ml_predictions_total', ...)
prediction_latency = Histogram('ml_prediction_latency_seconds', ...)
prediction_errors = Counter('ml_prediction_errors_total', ...)
predictions_per_second = Gauge('ml_predictions_per_second', ...)Data Quality Metrics
python
feature_mean = Gauge('ml_feature_mean', ['feature_name'])
feature_std = Gauge('ml_feature_std', ['feature_name'])
feature_min = Gauge('ml_feature_min', ['feature_name'])
feature_max = Gauge('ml_feature_max', ['feature_name'])
prediction_distribution = Histogram('ml_prediction_distribution', ...)
feature_distribution = Histogram('ml_feature_distribution', ['feature'])Business Metrics
python
fraud_rate = Gauge('ml_fraud_rate', ...)
false_positive_rate = Gauge('ml_false_positive_rate', ...)
revenue_protected = Counter('ml_revenue_protected_usd', ...)Part 7: Setting Alert Thresholds
Don't alert on everything. Here's how to set thresholds:
Accuracy Alerts
yaml
- alert: ModelAccuracyWarning
expr: ml_model_accuracy < 0.90
for: 30m
severity: warning
- alert: ModelAccuracyCritical
expr: ml_model_accuracy < 0.85
for: 10m
severity
Latency Alerts
yaml
- alert: LatencyHigh
expr: histogram_quantile(0.95, rate(ml_prediction_latency_seconds_bucket[5m])) > 0.3
for: 5m
severity: warning
- alert: LatencyVeryHigh
expr: histogram_quantile(0.99, rate(ml_prediction_latency_seconds_bucket[5m])) > 1.0
for: 2m
severity
Data Drift Alerts
yaml
- alert: FeatureDrift
expr: |
abs(
ml_feature_mean - ml_feature_mean offset 7d
) / ml_feature_std offset 7d > 2
for: 1h
severity: warning
- alert: PredictionDrift
expr: |
abs(ml_fraud_rate - ml_fraud_rate offset 7d) > 0.1
for: 2h
severity
Common Mistakes to Avoid
Mistake #1: Not Monitoring Accuracy in Production
❌ Don't:
python
predictions_total.inc()
✅ Do:
python
@app.post("/feedback")
async def feedback(transaction_id, actual):
predicted = get_prediction(transaction_id)
is_correct = (predicted == actual)
accuracy_metric.set(calculate_accuracy())Mistake #2: Alerting on Everything
❌ Don't:
yaml
- alert: AccuracyDropped
expr: ml_model_accuracy < 0.999
for
✅ Do:
yaml
- alert: AccuracyDropped
expr: ml_model_accuracy < 0.90
for: 30m
Mistake #3: No Retraining Strategy
❌ Don't:
✅ Do:
Mistake #4: Ignoring Data Drift
❌ Don't:
✅ Do:
python
feature_stats.labels(
feature='transaction_amount',
stat='mean'
).set(features['transaction_amount'])
```
---
Before you deploy:
- ✅ Predictions total (by class)
- ✅ Latency percentiles (P50, P95, P99)
- ✅ Error rates
- ✅ Model accuracy (when available)
- ✅ Feature statistics
- ✅ Business metrics
- ✅ Accuracy drop alerts
- ✅ Latency spike alerts
- ✅ Error rate alerts
- ✅ Data drift alerts
- ✅ Alert routing (Slack, PagerDuty)
- ✅ Real-time metrics dashboard
- ✅ Model performance trends
- ✅ Error investigation dashboard
- ✅ Business metrics dashboard
- ✅ Airflow DAG for retraining
- ✅ Performance threshold triggers
- ✅ Validation before deployment
- ✅ Rollback capability
- ✅ Notifications
- ✅ Runbook for common issues
- ✅ Alert response procedures
- ✅ Retraining process docs
- ✅ Dashboard explanations
Conclusion
Monitoring isn't optional for ML systems. Without it, you're gambling.
The complete stack:
Prometheus → Collects metrics
Grafana → Visualizes performance
Airflow → Automates retraining
What you get:
✅ Real-time visibility - Know what's happening
✅ Automatic alerts - Problems notify you
✅ Self-healing - System retrains automatically
✅ Historical data - Track trends over time
✅ Peace of mind - Sleep better at night
The workflow:
Instrument your API with metrics
Set up Prometheus to scrape them
Build Grafana dashboards for visibility
Configure alerts for issues
Create Airflow DAG for retraining
Let it run
My system now:
Checks performance every 15 seconds
Alerts me on Slack if issues
Retrains automatically when needed
Has retrained 3 times in 6 months
Accuracy stays above 90%
I sleep well
Set this up once. Benefit forever.
Want to see the complete system?
Check out my fraud detection project with full monitoring:
GitHub: github.com/Shodexco/fraud-detection-mlops
Questions? Let's connect:
Portfolio: jonathansodeke.framer.website
GitHub: github.com/Shodexco
LinkedIn: [Your LinkedIn]
Now go monitor your models. Future you will thank present you.
About the Author
Jonathan Sodeke is a Data Engineer and ML Engineer who learned monitoring the hard way (by deploying models without it). He now builds production ML systems with comprehensive monitoring, automated retraining, and proper instrumentation.
When he's not checking Grafana dashboards at 2am, he's building MLOps systems and teaching others to deploy ML models that don't fail silently.
Portfolio: jonathansodeke.framer.website
GitHub: github.com/Shodexco
LinkedIn: [Your LinkedIn URL]