Airbnb Hotspot Analyzer
Airbnb Hotspot Analyzer 🔗 GitHub Repo: https://github.com/Shodexco/airbnb-hotspot-analyzer Real-Time Pricing Intelligence • Multi-Tier Luxury Clustering • Interactive Geospatial Dashboard The Airbnb Hotspot Analyzer is a full end-to-end geospatial intelligence system that maps, clusters, and scores short-term rental markets across major cities worldwide. It automatically fetches the latest InsideAirbnb dataset, processes it in real-time, and generates premium/luxury/ultra-luxury investment hotspots using spatial clustering, landmark proximity scoring, and interactive Folium visualizations. This project combines data engineering, ML-based clustering, geospatial analytics, and a custom Flask dashboard to help investors, analysts, and operators instantly understand high-value rental pockets in any market. 🚀 What This System Does Identifies premium, luxury, and ultra-luxury clusters using DBSCAN + projected spatial coordinates (EPSG:3857) Generates interactive Folium maps with heatmaps, tier-colored markers, and landmark overlays Computes neighborhood investment scores using price × demand × location weighting Visualizes landmark proximity (downtown, beaches, parks, transit hubs, nightlife, universities) Runs on an integrated dashboard UI with real-time logs, map viewer, and Hotspot Explorer Exposes a REST API for programmatic analysis, automation, or downstream dashboards This is essentially a lightweight Airbnb market-intelligence engine that runs locally with zero cloud dependencies.
Year
2025
Service
Web Design
Category
Data Engineering
Tool
🧠 Key Features
Live Snapshot Fetching
Automatically scrapes InsideAirbnb’s “Get the Data” page and retrieves the most recent listings.csv.gz for any supported city.
Tiered Cluster Detection
Premium: $200–$999/night
Luxury: $1000–$2499/night
Ultra-Luxury: $2500–$5000/night
DBSCAN tuned per tier for realistic grouping
Full CRS projection for accurate distance measurements
Interactive Geospatial Maps
Price heatmaps
Gold / Blue / Red cluster markers
Optional landmark icons (stadiums, downtowns, beaches, universities, etc.)
Fullscreen toggle & smooth pan/zoom interactions
Hotspot Explorer (Built-in UI)
Browse:
Premium clusters
Luxury clusters
Ultra-luxury clusters
Neighborhood investment scores
Raw listing details
Auto-generated heatmaps & cluster views
REST API (Flask)
Endpoints to:
Run analysis for any city
Fetch generated CSV outputs
Retrieve maps
List supported cities
Trigger landmark scoring
Perfect for integration with BI tools, notebooks, or external dashboards.
🧩 Architecture & Pipeline
Fetch latest snapshot dynamically
Extract & clean listings
Normalize coordinates & project to EPSG:3857
Compute landmark proximity metrics
Detect premium/luxury/ultra-luxury clusters
Calculate neighborhood investment score
Render Folium maps (heatmaps + clusters)
Export logs, CSVs, and map assets
Serve results to Dashboard + REST API
This pipeline is optimized for repeatable, multi-city analysis.
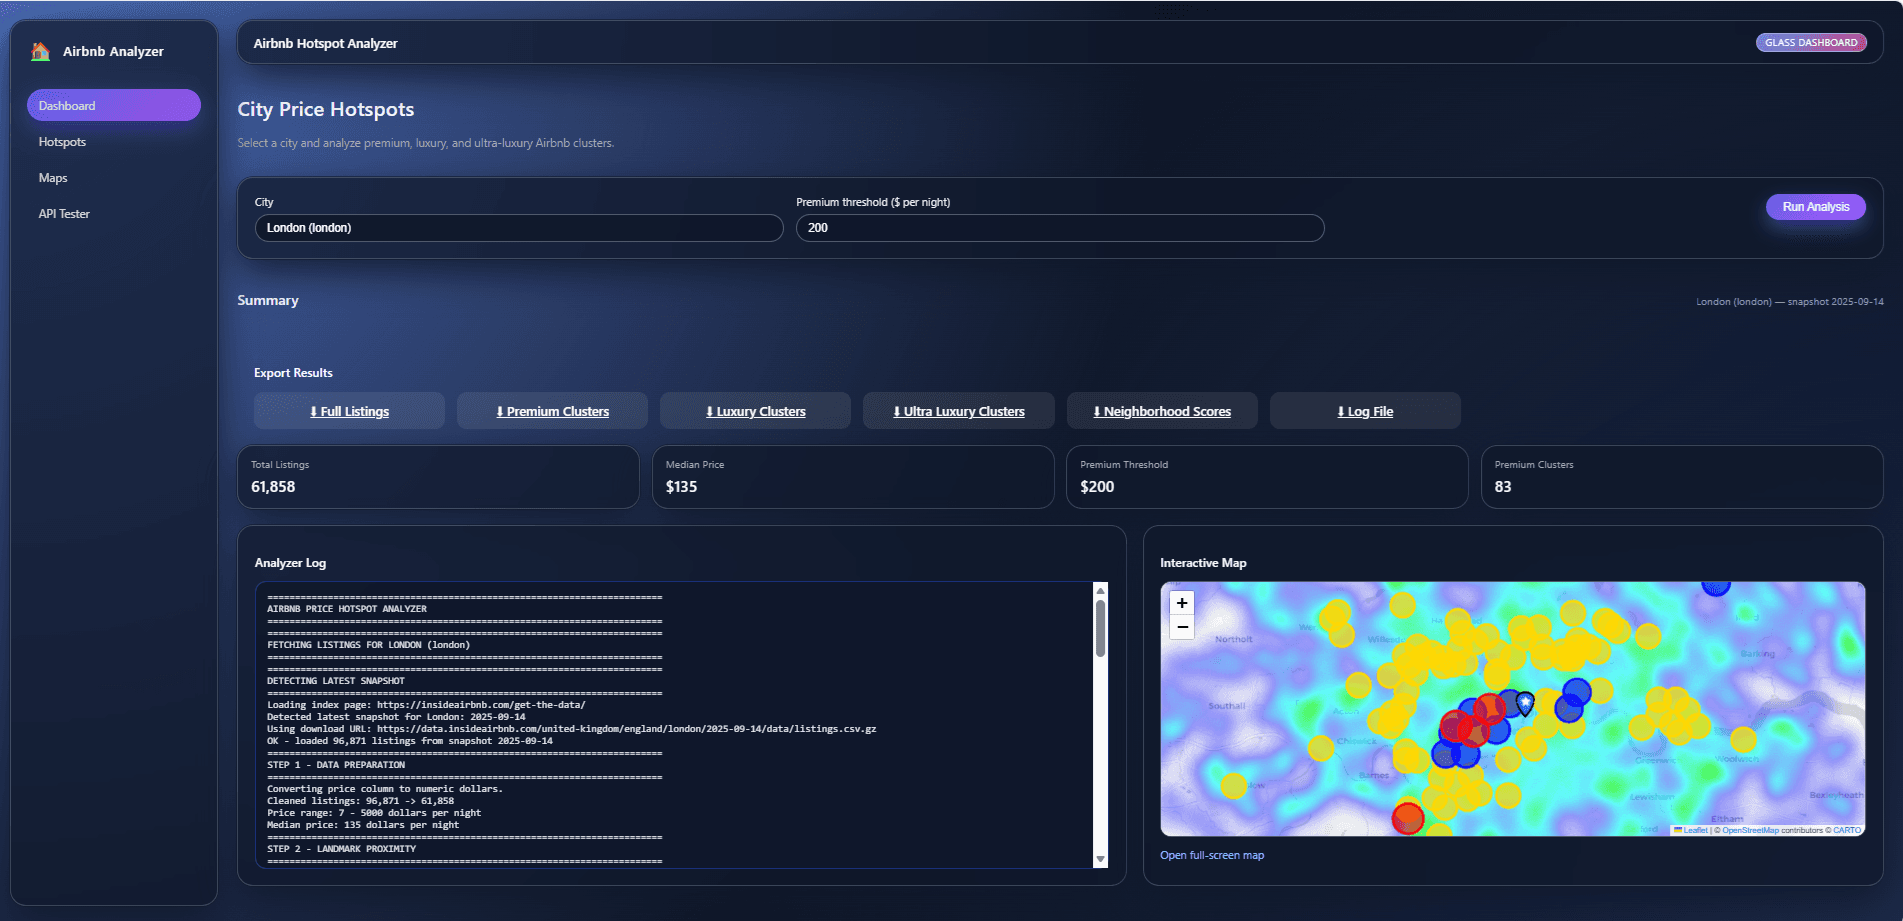
🖥️ Dashboard Preview
The Web UI provides:
City selection
Premium threshold controls
One-click analyzer
Log viewer
Hotspot Explorer
Integrated API tester
Export buttons for CSVs & maps
Everything runs locally via:
🌍 Supported Cities
NYC • Los Angeles • San Francisco • Boston • Chicago • Seattle • Washington DC • Austin • Miami • London • Paris • Barcelona • Amsterdam • Rome • Berlin
(Extendable via CITY_CONFIG.)
🛠️ Tech Stack
Python (Pandas, NumPy, Scikit-Learn, Geopandas optional)
Flask REST API
Folium / Leaflet.js mapping
DBSCAN clustering
BeautifulSoup snapshot scraping
HTML/CSS/JS dashboard
Gunicorn-ready for production
📁 Directory Overview
airbnb-hotspot-analyzer/
│
├── airbnb_analyzer.py
├── api_server.py
│
├── maps/
├── output/
│
├── static/
│ ├── css/
│ ├── js/
│ │ ├── dashboard.js
│ │ ├── hotspots.js
│ │ └── api_tester.js
│
├── templates/
│ ├── dashboard.html
│ ├── hotspots.html
│ ├── maps.html
│ └── api_tester.html
│
└── README.md
⭐ Why I Built This
The short-term rental market generates massive amounts of data — but most of it is static, scattered across CSVs, and difficult to interpret. I wanted a system that could:
pull fresh data instantly
cluster luxury segments accurately
visualize everything interactively
allow programmatic access via API
This project is the foundation for a future real-estate intelligence engine capable of tracking market movements daily.