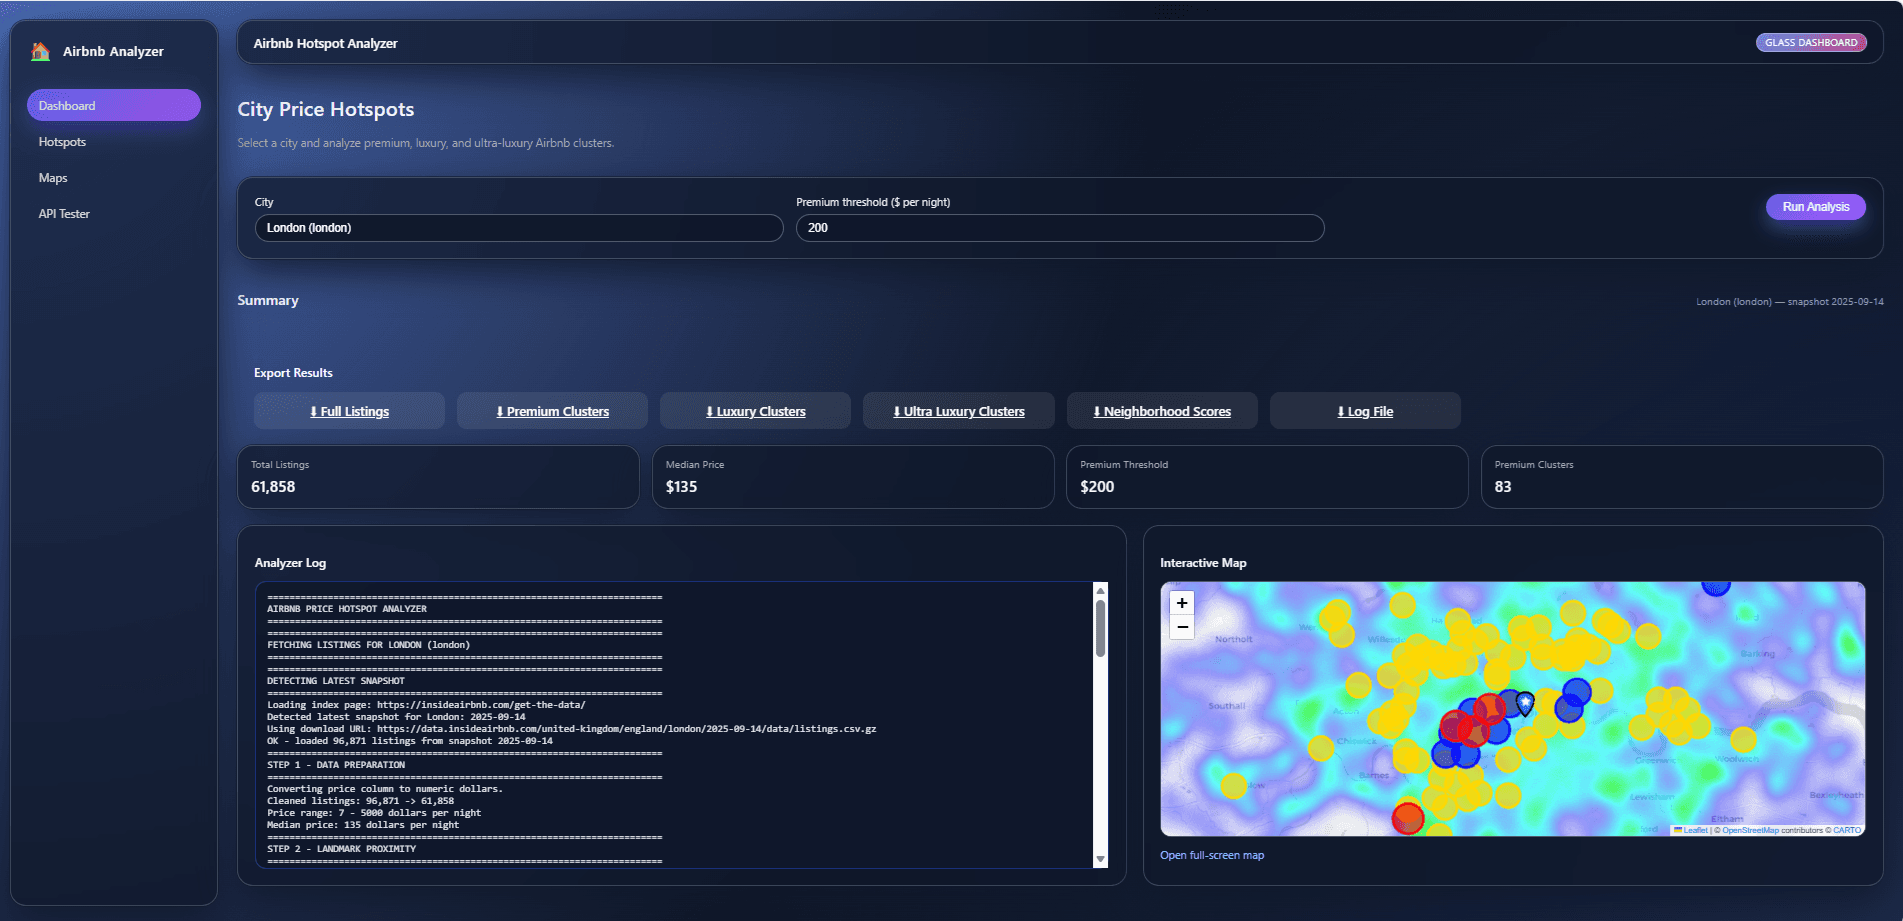
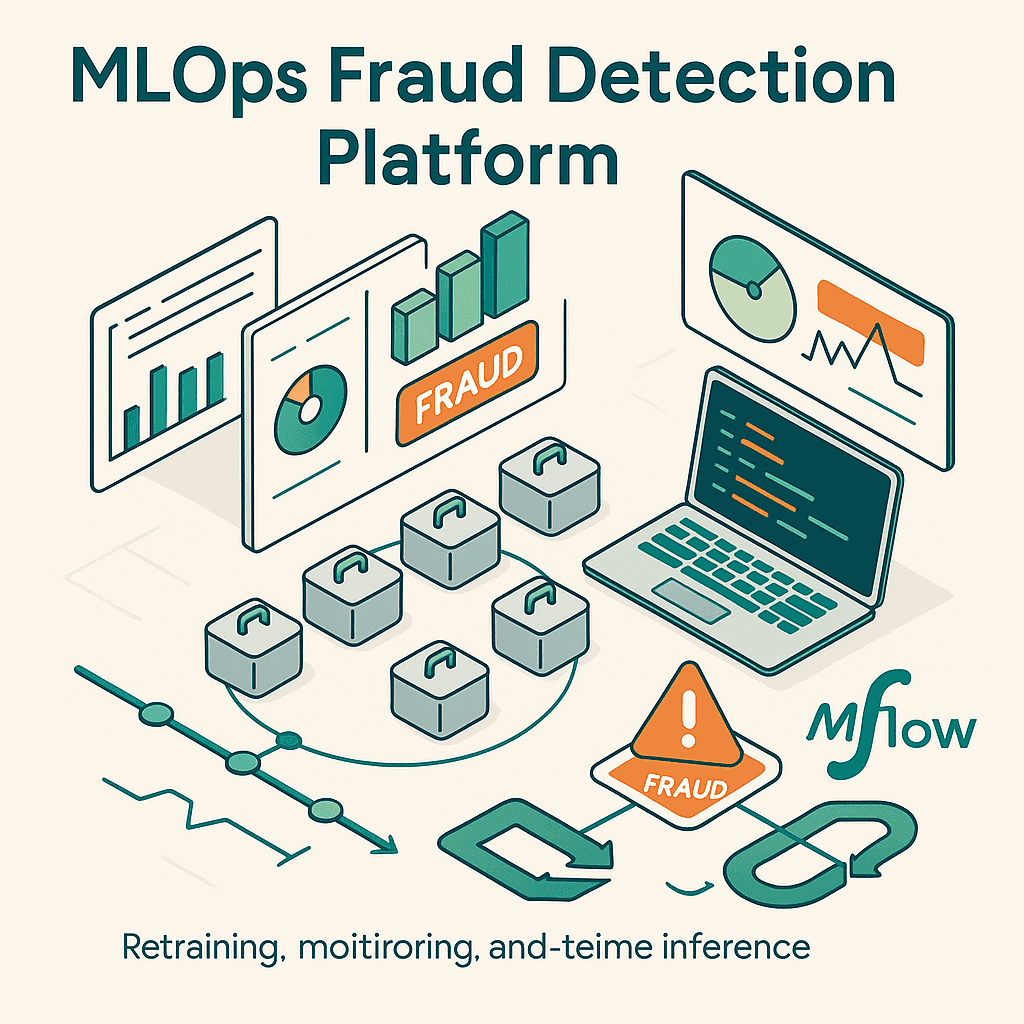
MLOps Fraud Detection Platform
A full end-to-end fraud detection system with retraining, monitoring, and real-time inference. Highlights 7-container Dockerized architecture Airflow for scheduling & retraining FastAPI inference (<120ms response time) MLflow tracking + artifacts CI/CD automation
Year
2024
Service
Web Design
Category
MLOps
Tool
FastAPI, Docker, Airflow, MLflow, PostgreSQL, Python
Fraud Detection MLOps System
Concept:
A production-grade, end-to-end MLOps pipeline for real-time fraud detection with automated retraining, monitoring, metrics tracking, and scalable deployment.
Problem Solved:
Enables consistent, reliable, and automated ML model lifecycle management — including training, evaluation, deployment, monitoring, and retraining — ensuring high accuracy and stable performance in a real-time fraud detection environment.
Scope:
Input:
Transaction data with numerical, categorical, and behavioral features.Process:
A full MLOps workflow integrating real-time inference, monitoring, retraining, and metric collection:Fraud Detection API (Flask): Serves real-time predictions via REST.
ML Model (Random Forest): Core training & inference logic.
Airflow DAG: Automates daily model retraining and performance checks.
MLflow Tracking: Logs experiments, versions, metrics, and artifacts.
Prometheus: Collects metrics (latency, fraud rate, prediction counts).
Grafana Dashboards: Visualizes system performance and alerts.
Docker Compose: Orchestrates all services for reproducible deployment.
Output:
Real-time fraud prediction API (<120ms latency), Prometheus metrics, Grafana monitoring dashboards, Airflow-managed retraining pipeline, and MLflow-tracked model versions.
Features:
Real-time prediction API (Fast inference: 80–120ms)
Automated daily retraining (Airflow)
MLflow model registry with experiment comparison
Prometheus metrics for API + model behavior
Grafana dashboards (fraud rate, latency, prediction volume, etc.)
Robust data preprocessing and feature engineering
Class balancing for imbalanced fraud data
End-to-end containerized setup (Docker Compose)
Performance monitoring and alerts
Versioned ML models with automatic deployment of improved variants
Tech Stack:
ML Framework: Scikit-learn
API: Flask
Workflow Orchestration: Apache Airflow
Monitoring: Prometheus + Grafana
Experiment Tracking: MLflow
Infrastructure: Docker, Docker Compose
Database: PostgreSQL (Airflow metadata)
Language: Python
System Components:
Fraud Detection API
/predict,/metrics,/health,/testReal-time inference
Metrics collection
Input validation
Airflow DAG
Five-stage retraining pipeline
Tasks: performance check, data prep, training, deployment, notification
Monitoring Stack
Prometheus metrics + Grafana dashboards
MLflow Tracking & Registry
Parameters, metrics, artifacts, versioning
Docker Orchestration
All services containerized and networked
Performance:
Model:
Accuracy: 95.2%
Precision: 94.8%
Recall: 89.3%
F1-score: 92.0%
ROC-AUC: 96.5%
API:
Latency: 80–120ms
Throughput: ~500 req/s (single instance)
Availability: 99.9%
Resource Usage:
Memory: ~2GB total
CPU: <60% under load
Project Structure:
(High level, no code)
models/— Model APIs, loaders, training scripts, artifactsairflow/— DAGs, logs, dependenciesdata/— Train & test datasetsprometheus/— Metrics configgrafana/— Dashboardsmlflow/— Artifacts, versionsdocker-compose.yml— Full stack orchestrationDockerfile/Dockerfile.airflow— Service containers
Output:
Fraud predictions, latency metrics, dashboards, tracked models, logs, alerts, retraining output.
Future Enhancements:
SHAP explainability
A/B testing framework
Data drift detection
Slack/email notifications
Authentication & rate limiting
Kubernetes deployment
Ensemble modeling (XGBoost + RF)
Kafka streaming
Mobile app extension
GitHub Repository:
https://github.com/yourusername/mlops-fraud-detection
(Replace with the actual repo URL once pushed.)
API Documentation (Local Dev):
http://localhost:8080
http://localhost:8080/predict
http://localhost:8080/metrics
Airflow UI:
http://localhost:8081
Credentials: admin / admin
MLflow Tracking UI:
http://localhost:5000
Grafana Dashboard:
http://localhost:3000
Credentials: admin / admin
Prometheus:
http://localhost:9090